Economics of Rail versus Pipeline

Summary

Comparing the economics of shipping heavy crude oil or bitumen on pipeline versus rail requires understanding the following concepts:

  • Normalization of units shipped
  • The diluent penalty
  • Embedded costs that aren’t readily apparent

The following chart summarizes the example of shipping one barrel (42 US gallons) of pure bitumen 2,500 miles from the Fort McMurray area to the US Gulf coast. Origin gathering and destination distribution are not considered since in both cases the oil has to be brought to either the pipe head or rail head by truck or pipeline at origin and distributed at destination by local distribution networks.

Rail costs assume loading 567 barrels of 956 kg/m3 at 15ºC (12API) undiluted bitumen into 25,330 US gallon tank cars with a track weight limitation of 268,000 gross weight on rail (GWoR). Rail rates are calculated using the American Association of Railways published 2015 cents per ton-mile average rail rates for all services all types of commodities (generic rail rate, non-negotiated).

The chart compares 5 scenarios:
  1. Long term commitment costs on both diluted bitumen (“dilbit”) and condensate (“diluent”) pipelines
  2. Interruptible (uncommitted) costs on both dilbit and condensate pipelines requiring trucking of condensate from a typical condensate hub in Edmonton to the Ft. McMurray area
  3. Undiluted bitumen on rail using generic readily available non-negotiated rates (AAR Generic)
  4. Dilbit on rail using generic readily available non-negotiated rates (AAR Generic)
  5. Undiluted bitumen on rail using generic readily available non-negotiated rates (AAR Generic) discounted 25% for unit train service

The chart shows that undiluted shipments of bitumen or heavy oil by rail is very competitive with pipelines being 12% to 31% less for rail versus committed pipelines. However, when diluent is added rail becomes uncompetitive. Comparing the diluted versus undiluted costs shows the very large negative impact the “diluent penalty” has on costs regardless of mode of transport. The following sections are for those interested in the detail of the model calculations for the chart.

Economics of Rail versus Pipeline
Click image to enlarge (+)

Understanding the Cost Components

While some of the tolls for heavy crude are published publicly others are not. Where possible public data and public tolls were used as source data. Generally, pipelines have rates for shippers who take a commitment over long periods of time in the 10 to 20 year range and one for no commitment except by month. To note, according to the TransCanada tariffs the batch sizes are very large and the commitment term is long. This would allow only the most credit worthy producers to meet these requirements. Others may have to provide costly letters of credit to meet the requirements for the committed toll rate which is not included in the calculations here.

Heavy Crude Pipeline Tolls

Either way, the producers balance sheet would be impacted by taking on these long term agreements for so much volume. A 20-year commitment of 100K bbls/day at $11.52/bbl would be over $8.4 billion. It is fair to say that most producers could only avail themselves of the uncommitted toll.

One of the single biggest misunderstandings in comparing pipeline to rail costs is exactly what is being transported and why. The goal is to transport bitumen to the market. In order to do that in a pipeline, the bitumen must be diluted at various ratios of condensate (a diluent) to bitumen or heavy oil depending on viscosity of the oil for it to be able to flow in a pipeline. Typically, bitumen from the Fort McMurray area would be blended with 30% condensate. This blend is called “dilbit”.

Normalization

The misunderstanding starts when pipeline tolls are quoted in dollars per barrel. It is true that a pipeline toll of $12.05/bbl would be the cost to move one barrel (42 US gallons) of dilbit but not the cost to move one barrel of bitumen. The $12.05 pipeline toll would only move 29.4 US gallons of bitumen to market not 42 US gallons and would also move 12.6 US gallons of condensate.

In order to move 1 barrel of bitumen to market on a pipeline, it would require 18 US gallons of condensate. The total dilbit blend would then be 60 US gallons. There are two ways to look at the cost to move one barrel of bitumen but they both yield the same result.

normalize to one barrel

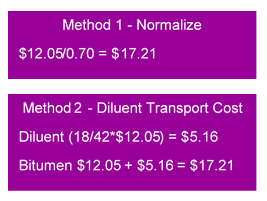
Method 1 is the easiest way to understand. Since a pipeline toll of $12.05 in this blend ratio would only move 70% of a barrel of bitumen, simply divide the toll by 0.7 to normalize to 1 barrel.

Method 2 calculates the cost to move the diluent portion of the normalized barrel. Since it requires 18 US gal of condensate to move 42 US gallons of bitumen, the cost to transport the condensate (diluent) portion is 18/42*$12.05 = $5.16. This is added to the cost to transport 42 gallons (1 barrel) of bitumen.

In the chart, this cost is referred to as Diluent Transport to USGC.The chart also uses method 2 ratio to cost for all other calculations requiring normalization of costs to transport 1 barrel of bitumen.

The term “diluent penalty” refers to all of the costs associated with using a diluent to move bitumen or heavy oil in a pipeline. These diluent costs are frequently overlooked and are not well understood.

With rail, diluent is not needed and in fact is not desired to be in the oil. Most of the billions of dollars of infrastructure that is currently built to move the diluent in pipelines, terminals, trucks and so on is not needed when using rail.

The Diluent Penalty
Click image to enlarge (+)

The diluent penalty costs can be grouped as follows:

  1. The cost to move the diluent as part of the dilbit mixture from origin to destination. In this case either by pipeline or truck to Edmonton (or Hardisty) and then pipeline to the USGC.
  2. The cost to strip the diluent out of the oil at destination.
  3. The cost to ship the diluent back from the destination back to the diluent hub such as Edmonton either by pipelines or rail.
  4. The cost to ship the diluent from the diluent hub back into the field to the producer either by pipeline or truck.
  5. The differential loss between the price paid for the diluent at the diluent hub and what it is sold for as part of the dilbit blend in the USGC.
  6. Losses in transport and handling throughout the entire logistics chain.
  7. The time value of money while the diluent is in the system.

This round trip cycle occurs over and over again in pipelines but can be completely avoided with rail. However, if a dilbit mixture is shipped by rail it will be subject to the same diluent penalty costs.

The cost of transporting diluent as part of the dilbit mixture has already been shown in the Normalization calculations. This part of the diluent penalty can be calculated precisely since is just a function of the ratio of diluent to bitumen and the pipeline toll.

What is more difficult to understand and often shows the inefficiency of the system is the loss between what it costs to buy diluent from the Edmonton pool and what the dilbit mixture sells for in the USGC. This is called the “differential loss”.

Cost of the Diluent Penalty
Click image to enlarge (+)

One way to understand this differential is to look at the cost to transport diluent from the USGC to Edmonton. The cost to buy diluent in Edmonton should at least be the cost of diluent in the USGC plus the cost of transport on the pipelines to get the diluent to Edmonton.

For example, if condensate sells for $50 US/bbl in the USGC then it should sell for at least $50 plus the pipeline tolls shown in the chart here plus the terminal costs and losses.

Notice that there are two rates. One for committed volumes over typically 10 – 20 years and one for uncommitted volume. The rate is exactly double for uncommitted volume. In each case, the minimum daily batch is 20,000/bbls per day which would require about 67,000/bbls per day of bitumen production to blend with on a 30/70 ratio.

Since these pipelines and associated terminals costs billions of dollars to build, it should be expected that the differential should also include some return for those who took the risk in committing to this infrastructure.

There are other sources of diluents. Some of these are not pipeline connected and have used rail to bring condensates in from various sources in the US. Recently, more domestic condensate production has become available from rich gas production from areas in Alberta and British Columbia but these are still not sufficient to supply the market and therefore would not set the market price in an efficient market system.

summary chartThe analysis in the summary chart assumes the differential to be $12.50 US/bbl which would be reasonable over time in an efficient market system. This cost is labelled the “Diluent Differential Loss” in the summary chart. This cost has to be normalized to the cost to move one barrel of bitumen which would be 30/70 *$12.50US = $5.36 US.

Of course, the differential loss is set by various market influences and can not be precisely set as a fixed number from a formula. Is does fluctuate up and down based on market and other conditions. However, any differential loss less than the cost to move the diluent would mean the system is inefficient and parties along the logistics chain are losing money.

Once the diluent arrives at the diluent hub, it needs to be transported to the production site in the field which in this case is in the Fort McMurray area. This is usually done via pipeline connection from the diluent hub or by truck.

Although there is more than one pipeline that is connected to the hub, they are not common carrier type pipelines that publish open tariffs. They are generally contracted by parties over a long term of 10 to 20 years in confidential contracts. The example here uses Inter Pipeline’s Polaris pipeline which connects to several producers in the Fort McMurray area. While Inter Pipeline does not publish an open tariff for this pipeline, they have published serval press releases from which the implied tariff can be calculated. The table opposite shows three different sizes of volume commitment and the yearly EBITDA from the press releases to calculated a weighted average for the toll on this pipeline Of course, using EBITDA will under estimate the toll since this calculation is net of costs but it is the best public information that could be found. Using a $0.76 US = $1 CDN exchange rate, the implied toll is $1.97 US/bbl. This does not include any cost for a letter of credit should a producer not have a sufficient credit rating for the pipeline commitment. Again, this toll has to be normalized to moving one barrel of bitumen which would be $1.97 US x 30/70 = $0.84 US/bbl.

Trucking tolls are far more expensive than pipelines but do not require the same credit or long term commitment. Trucking tolls can be calculated either by the hour, by the mile or both. The chart opposite uses both mileage and hours. Trucks are also subject to loading fees at the diluent hub. Using conservative industry standard fees and an exchange rate of $0.76 US = 1 $CDN, the trucking toll would be about $6.12 US/bbl. Normalizing to the cost to move one barrel of bitumen the toll would be $6.12 US x 30/70 = $2.62 US/bbl.

condensate
Click image to enlarge (+)
trucking tolls
Click image to enlarge (+)

There are other embedded costs to use a pipeline that aren’t readily apparent and apply differently to different shippers. The following is a non-exhaustive list of some of those “hidden” items:

  • Quality equalization, quality degradation
  • Batch interface costs
  • Excessive treating costs to meet pipeline transportation specifications
  • Time value of money
  • Credit costs
  • Loss allowances
  • Batching and storage costs

A few of items are discussed below and some and some have cost estimates calculated below.

Time Value of Money – Line Fill & Transport Time

A pipeline has to be filled over the distance of the pipeline. This has a time value of money cost both in terms of the oil that must fill the line and the time it takes for a batch to transit the pipeline from one end to the other. A dilbit pipeline flows at about 2 miles per hour. Not accounting for batching, a shipment would take about 52 days to travel 2,500 miles. A unit train moving at an average of 25 miles per hour would traverse the same distance in just over 4 days. The time value of the money of oil in the pipeline is not insignificant and is about 12.5 times higher than rail.

Time Value of Money

Batching & Storage

Pipelines charge terminating fees for storage and throughput to create batches. A production rate of about 20,000 bbls/day (9,537 M3) would take about 3 days and 6 Stream Days to build a 60,000 bbl batch which is about the same size as a unit train. The cost goes up for smaller stream rates and goes down for larger stream rates. In this example, it would cost $0.23/bbl to build a batch of 60,000 bbls. This example only covers the origin point but if batches have to be interchanged on pipeline systems these costs would be double or more.

Batching Storage

Loss Allowances & Quality

Because of the amount of handling of the diluent and dilbit, losses occur. Loss allowances vary from about 0.05% on dilbit pipelines to about 1.5% in condensate pipeline and truck systems. There are also formulas for product quality equalization that are outside of commercial seller-buyer negotiations which can lead to losses for certain producers. Since rail does not need diluent and because the product is segregated in each tank car, losses are minimized and quality is a direct commercial negotiation between seller and buyer.

Loss Allowances & Quality

Excessive Treating Costs

Dilbit pipelines require that the dilbit meet certain specifications and in particular, the amount of water that can be part of the dilbit mixture. This means that the bitumen has to go through expensive treatment to remove the water to meet the maximum water allowed in a pipeline of 0.5%. For rail, this is only a commercial consideration not a transportation consideration. The commercial consideration on rail versus the cost of treatment has tended to set the maximum water content on rail at 2%.

Higher levels of water reduce treating costs and water disposal costs. In some cases, this level can be achieved with field treating and thus reduce the cost of treating and the transport cost of oil to a treating facility and then to a pipeline terminal. Transporting oil to and from treating facilities can add dollars per barrel alone.

A conservative estimate for all these and other hidden costs would be at least $2.00 US/bbl.

Railways are common carriers and are required to provide rates on all of the rail lines they operate. Public rates can be found in open tariffs or the public can request a rate and it would be published in an open tariff, limited distribution tariff or a confidential contract. Open tariff rates are non-negotiated rates and tend to be higher than negotiated rates and specific to a particular market segment.

With the deregulation of the industry in Canada and the US in the late 80’s and mid 90’s, parties can negotiate a private confidential contract. Railways and shippers can enter into confidential contracts on commercial terms versus the regulated terms and rates prior to deregulation.

Common carrier pipelines still operate commercially in many ways like the old regulated rail industry. The regulatory authority prescribes formulas for the pipeline open tariff rates like some of those tariffs cited here. However, there are pipelines that are built that are proprietary and thus rates are not public.

Railways set commercial rates using the following criteria:

  • Track weight limitations. Generally, the track weight limit is 286,000 lbs gross weight on rail (GWoR). Meaning the rail cars total weight can’t exceed 286,000 lbs. Not all track has that high of a limit. The track to Ft. McMurray for example is limited to 268,000 lbs.
  • Shipment weight (GWoR)
  • Distance and route travelled
    • Railways are very efficient on long hauls. Their cost per mile tends to go down as the distance travelled increases.
    • Railways often have to interchange traffic with one another to get to destination. Generally, rates are higher when more than one railway is involved in the shipment.
  • Service type
    • Manifest service is generally for smaller shippers whose shipments will be aggregated with other shippers to make a full train.
    • Unit train service is for larger shipments usually of 100 cars or more from one origin to one destination for one shipper.
    • Rates for unit trains are typically in the range of 25% cheaper than for manifest shipments.
    • Transit time for unit trains are about 1/3 faster.
  • Market conditions
  • Commodity being shipped
    • Generally, regulated dangerous commodities are charged a higher rate.
    • Very dangerous products will have much higher rates than for other commodities.

Because of the confidential nature of rail contracts and the lack of commercial open tariffs, it is difficult to cite a direct public source for specific rail rates.

Although the rail industry is governed by government regulatory authorities in Canada and the US for items such as safety and operating rules, the American Association of Railways (AAR) is an industry body that governs industry matters such as interchange and car hire rules. The AAR has many functions but one is to collect data about the rail industry.

One of the data elements they collect from all railways is a sample of the revenue they make on a $US cents per ton-mile basis. The sample is based on all services types, all commodities and over various distances and routes. This a good representation of what a shipper could expect to pay a railway in Canada and the US without much if any negotiation. This is the generic AAR rate used here in the rate model.

The rate rail model is significantly simpler to understand since it is only concerned with shipping pure bitumen or heavy oil. However, there are some concepts that need to be understood.

Pure Bitumen or Heavy Oil
  • Tank cars are typically leased for a term of 1 – 7 years and are paid for by month.
  • The lease cost per shipment depends of how fast the cars cycle between loads.
  • The amount of oil that can go into a tank car depends on:
    • Volumetric capacity
    • The tare weight (weight of the empty car)
    • The load weight limits of the car
    • The temperature and density of the oil at loading
    • The lowest track weight limitation in the route
  • It is very important to use the optimal car type so that the car will have the maximum volume in it before it exceeds either the weight load limit of the car or the track.
  • To provide for a margin of error, the tank car used in the model is loaded to 98% of it’s weight load limit and 94% of it’s volume at the loading temperature of 60C.
  • Rail rates include moving the car back empty to any origin to reload, not just the original origin. Empty to empty moves will however be charged.
  • Rail rates do not include loading or unloading the car. There are fees to be paid both at origin and destination to load and unload the car.
    • Terminal fees at origin generally include throughput tank storage if used otherwise the cars are loaded direct from truck
    • Terminal fees at destination will generally include only unloading the car into terminal storage so the local distribution network can take the oil to final destination. In some cases, cars are unloaded directly at the refinery.
  • Undiluted heavy crude or bitumen is not a regulated dangerous commodity in Canada. It ships under US regulations as an NA1993 placarded commodity.

Moving diluted oil by rail suffers the same diluent penalties borne by pipelines. But the diluent penalty is far worse for rail since the rail rate, loading and unloading terminal fees and lease car costs have to be normalized to one barrel of bitumen.

Diluent transportation = 30/70 x $16.56 = $7.10

Terminal & Lease fees = $5.62/0.70 = $8.02

The diluent penalty makes shipping diluted crude oil by rail uneconomic versus pipeline. However, there may still be situations where a producer may need or want to use rail. For example, credit is less of an issue with rail and can access more markets.

Below is a list of reference documents used for the calculations in this model. Links are also given to the website sources for updated document information.